#======================================================
# Kriging with Matérn covariance
#======================================================
library(ggplot2)
library(gridExtra)

set.seed(42)

#------------------------------------------------------
# True parameters
#------------------------------------------------------
N_s     <- 80        # number of observation locations
range   <- 0.25      # Matérn length-scale
nu      <- 1         # Matérn smoothness
sigma_u <- 1.0       # process SD
sigma_e <- 0.15      # nugget (measurement noise) SD sigma_e
mu_true <- 0.0       # constant mean mu

#------------------------------------------------------
# Matérn correlation function
#------------------------------------------------------
matern_cov <- function(coords1, coords2 = NULL, nu = 1, range, sigma2 = 1) {
  if (is.null(coords2)) coords2 <- coords1
  n1 <- nrow(coords1); n2 <- nrow(coords2)
  D  <- as.matrix(dist(rbind(coords1, coords2)))[1:n1, (n1+1):(n1+n2), drop = FALSE]
  D[D == 0] <- 1e-10          # avoid 0 argument to besselK
  s  <- sqrt(2 * nu) * D / range
  C  <- (2^(1 - nu)) / gamma(nu) * s^nu * besselK(s, nu)
  if (n1 == n2 && isTRUE(all.equal(coords1, coords2))) diag(C) <- 1
  sigma2 * C
}

#------------------------------------------------------
# Observation locations: N_s uniform points in [0,1]^2
#------------------------------------------------------
obs_locs <- matrix(runif(N_s * 2), ncol = 2, dimnames = list(NULL, c("s1", "s2")))

#------------------------------------------------------
# Simulate the latent field U(s) ~ GRF(0, sigma2 C) via Cholesky:
#------------------------------------------------------
Sigma_U <- matern_cov(obs_locs, nu = nu, range = range, sigma2 = sigma_u^2)
diag(Sigma_U) <- diag(Sigma_U) + 1e-9     # For numerical stability
L_U    <- t(chol(Sigma_U))
U_true <- as.vector(L_U %*% rnorm(N_s))

#------------------------------------------------------
# Observations: y(s)
#------------------------------------------------------
y_obs <- mu_true + U_true + rnorm(N_s, sd = sigma_e)

#------------------------------------------------------
# Kriging — build observation covariance Σ_y = sigma2_u C(S,S) + sigma2_e I
#------------------------------------------------------
Sigma_y <- matern_cov(obs_locs, nu = nu, range = range, sigma2 = sigma_u^2) +
           (sigma_e^2 + 1e-9) * diag(N_s)
L_obs   <- t(chol(Sigma_y))

# Kriging weight vector "alpha" via two triangular solves
alpha <- backsolve(t(L_obs), forwardsolve(L_obs, y_obs - mu_true))

#------------------------------------------------------
# Prediction: 30 × 30 regular grid on [0,1]^2
#------------------------------------------------------
N_grid    <- 30
pred_grid <- as.matrix(expand.grid(s1 = seq(0, 1, length.out = N_grid),
                                   s2 = seq(0, 1, length.out = N_grid)))

#------------------------------------------------------
# Kriging prediction at each grid point
# Cross-covariance  k* = sigma2 c*  (N_pred × N_obs matrix)
#------------------------------------------------------
k_cross  <- matern_cov(pred_grid, obs_locs, nu = nu, range = range, sigma2 = sigma_u^2)
krig_mean <- mu_true + as.vector(k_cross %*% alpha)

V <- forwardsolve(L_obs, t(k_cross))
krig_var <- pmax(sigma_u^2 - colSums(V^2), 0)
krig_sd  <- sqrt(krig_var)


#------------------------------------------------------
# Plots
#------------------------------------------------------
val_lim <- range(c(U_true, y_obs, krig_mean))

obs_df <- data.frame(s1 = obs_locs[, "s1"], s2 = obs_locs[, "s2"],
                     U  = U_true, y  = y_obs)

pred_df <- data.frame(s1 = pred_grid[, "s1"], s2   = pred_grid[, "s2"],
                      mean = krig_mean, sd   = krig_sd)

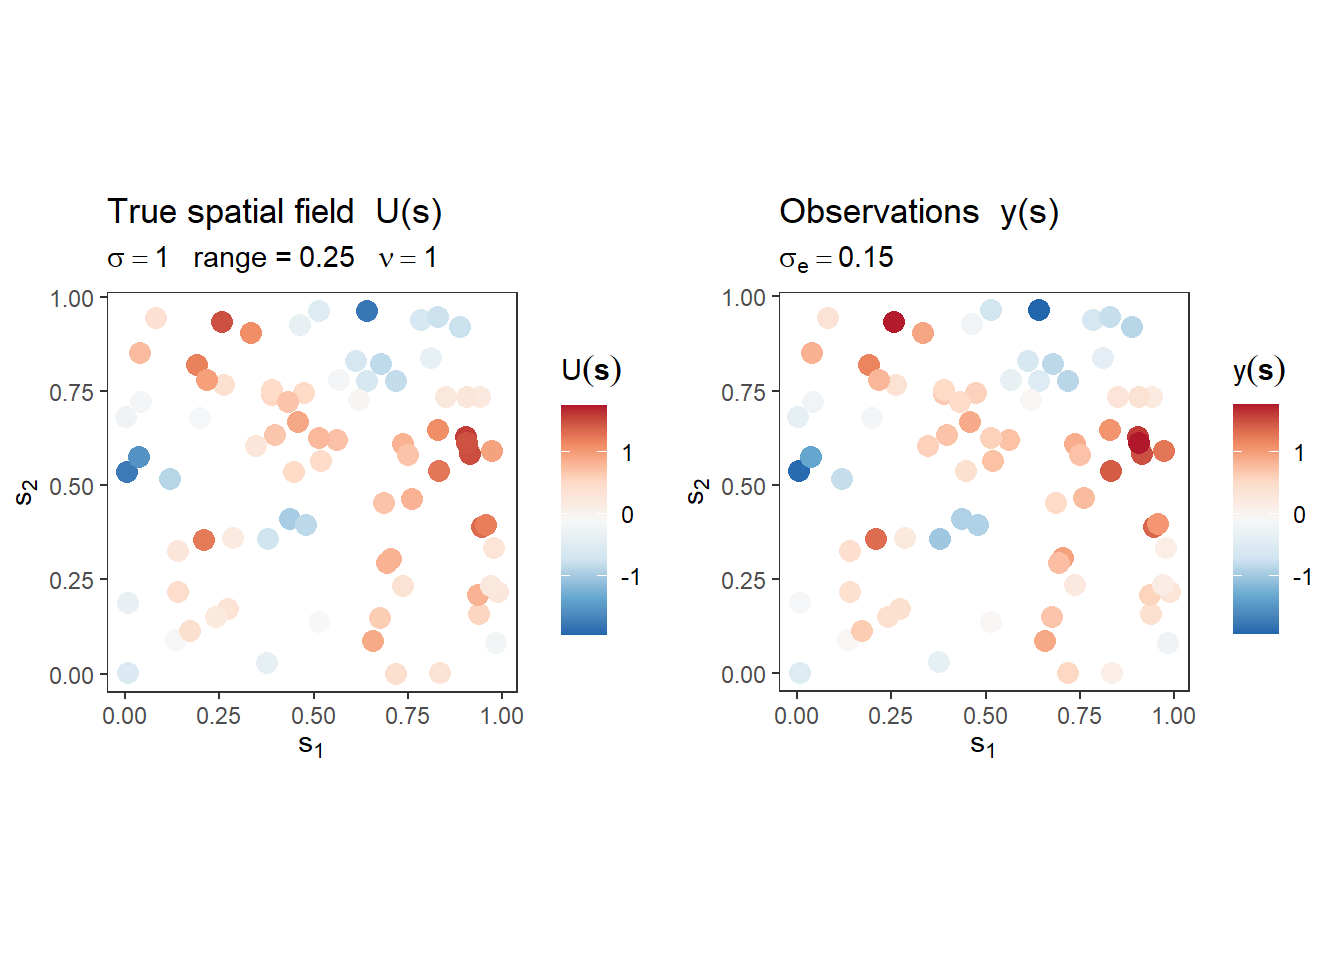
# True spatial field at observation locations
p_true <- ggplot(obs_df, aes(s1, s2, colour = U)) +
  geom_point(size = 3.5) +
  scale_colour_distiller(palette = "RdBu", direction = -1,
                         limits = val_lim, name = expression(U(bold(s)))) +
  coord_equal() + theme_bw(base_size = 11) +
  theme(panel.grid = element_blank()) +
  labs(title    = "True spatial field  U(s)",
       subtitle = bquote(sigma == .(sigma_u) ~ "  range =" ~ .(range) ~
                           "  " * nu == .(nu)),
       x = expression(s[1]), y = expression(s[2]))

# Observations
p_obs <- ggplot(obs_df, aes(s1, s2, colour = y)) +
  geom_point(size = 3.5) +
  scale_colour_distiller(palette = "RdBu", direction = -1,
                         limits = val_lim, name = expression(y(bold(s)))) +
  coord_equal() + theme_bw(base_size = 11) +
  theme(panel.grid = element_blank()) +
  labs(title    = "Observations  y(s)",
       subtitle = bquote(sigma[e] == .(sigma_e)),
       x = expression(s[1]), y = expression(s[2]))

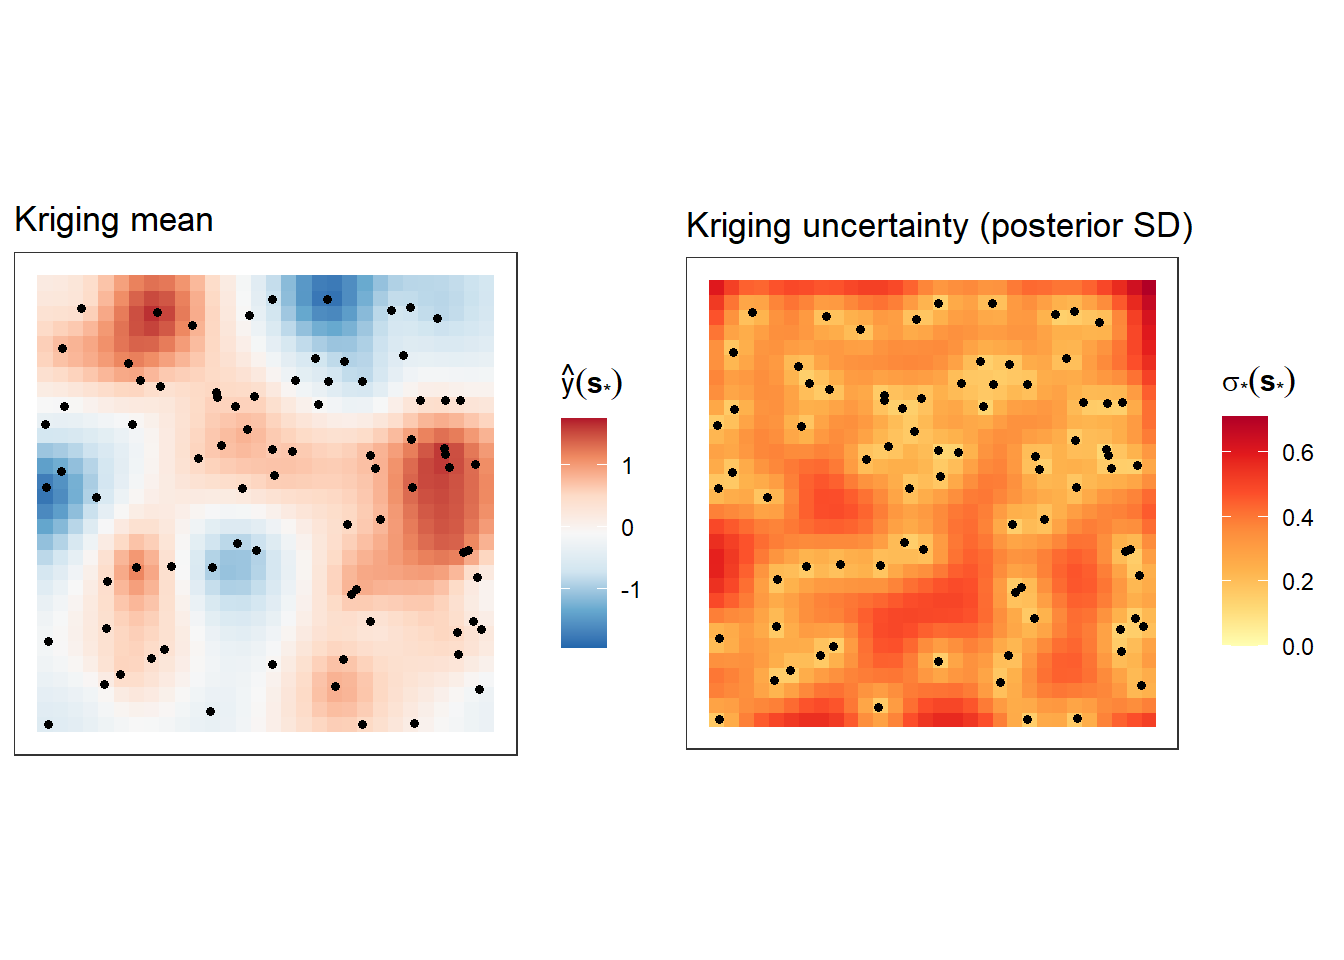
# Kriging mean
p_krig_mean <- ggplot(pred_df, aes(s1, s2, fill = mean)) +
  geom_raster() +
  geom_point(data = obs_df, aes(s1, s2),
             inherit.aes = FALSE, colour = "black", size = 1.2) +
  scale_fill_distiller(palette = "RdBu", direction = -1,
                       limits = val_lim,
                       name = expression(hat(y)(bold(s)["*"]))) +
  coord_equal() + theme_bw(base_size = 11) +
  theme(axis.text = element_blank(), axis.ticks = element_blank(),
        panel.grid = element_blank()) +
  labs(title    = "Kriging mean",
       x = NULL, y = NULL)

# Kriging posterior SD
p_krig_sd <- ggplot(pred_df, aes(s1, s2, fill = sd)) +
  geom_raster() +
  geom_point(data = obs_df, aes(s1, s2),
             inherit.aes = FALSE, colour = "black", size = 1.2) +
  scale_fill_distiller(palette = "YlOrRd", direction = 1,
                       limits = c(0, NA),
                       name = expression(sigma["*"](bold(s)["*"]))) +
  coord_equal() + theme_bw(base_size = 11) +
  theme(axis.text = element_blank(), axis.ticks = element_blank(),
        panel.grid = element_blank()) +
  labs(title    = "Kriging uncertainty (posterior SD)",
       x = NULL, y = NULL)

grid.arrange(p_true, p_obs,          ncol = 2)
6 Comments
An interesting comment was made on Linkedin by Ruben Roa Ureta (View here the comment in LinkedIn). Thus, in the next post I will consider his observation to make a comparison between the Maximum Likelihood method and Bayesian inference using the MCMC method (only in estimation terms) along with the uncertainty quantification for predictions in Kriging!